Dear Friends, today we will learn about SBI share price, SBI(State Bank of India). SBI share price target 2025, SBI share price target 2030, SBI share price target in 2024, etc. This will be analyzed by the fundamental and technical analysis of SBI share price. We will also be learning about SBI share price history and SBI dividend payout. Let us begin.
SBI
Before we jump to SBI share price target 2025, let us learn about the bank. State Bank of India, popularly known as SBI, is a multinational PSU(Public Sector Bank) headquartered in Mumbai, Maharashtra. SBI is the largest bank in India. SBI was the only bank that featured in the Fortune Global 500 list. The predecessors of SBI were Bank of Madras, Bank of Bombay, Bank of Calcutta, and Imperial Bank of India. SBI has more than 25000 branches in India and more than 200 branches in more than 36 countries.
The non-banking subsidiaries of SBI are SBI Capital Markets, SBI Mutual Funds, SBI Cards, and SBI Life Insurance Company Ltd. SBI operates more than 60000 ATMs across India. SBI also offers its digital banking platform YONO, which is popular among its customers.
Table of Contents
Fundamental Analysis – SBI share price
The table below is the Profit and Loss statement of SBI. The revenue of the bank has been Rs 350845 cr in the financial year ending March 2023. The net profit earned by the bank is Rs 57750 cr and the EPS delivered in 62.3
| P&L | Mar-21 | Mar-22 | Mar-23 |
| Revenue (in cr) | 278115 | 289973 | 350845 |
| Interest (in cr) | 156010 | 156194 | 189981 |
| Expenses (in cr) | 192821 | 197349 | 204303 |
| PBT(in cr) | 32796 | 49739 | 75399 |
| Tax % | 26% | 27% | 25% |
| Net Profit (in cr) | 23888 | 37183 | 57750 |
| EPS | 25.1 | 39.6 | 62.3 |
The company has delivered an ROCE of 5.2% and an ROE of 16.8%. The compounded sales growth of the company over the last decade is 8% and the stock price CAGR is 13% during the same time period. The Compounded profit growth by SBI is 12% during the last 10 years. Readers who wish to learn more about the SBI fundamentals, pls click here.
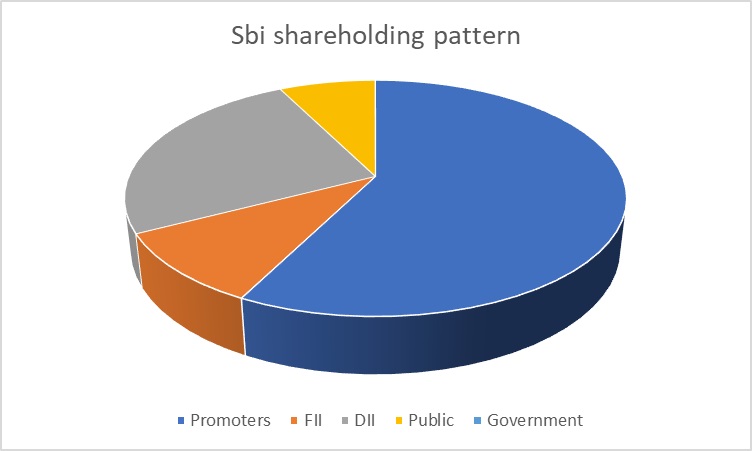
SBI shareholding pattern
The pie chart below is the current SBI shareholding pattern. The promoters hold 57.49% shares of SBI. The FIIs hold 9.9% of the shares and the DIIs holding is at 25.2% currently. The Public holds 7.4% stake in SBI. It is to be noted that the shareholding pattern in SBI has been more or less constant over the last three years.
Technical Analysis – SBI share price
Let us understand SBI price action through the study of its technical chart on the monthly time frame.

Above is the technical price action chart of SBI share price on the monthly time frame from the year 2007 to 2023. The first trendline is drawn at the level of Rs 152.6 in 2017. The breakout of this level was achieved by the price after 9 months. After this breakout, the price reached a level of Rs 242.85 within four months. The second trendline is drawn at this level. As you can see in the picture above, the price couldn’t be sustained at this level and breached the previous support of Rs 152.6 within the next 4 months. The price slid further down to the level of Rs 89.15 and started its upmove again.
The price broke out of the first trendline at Rs 152.6, acting as resistance now, in three months, and moved further up. SBI share price nse retested the resistance zone of Rs 242.85 within 5 months of this breakout and went into the consolidation phase. It remained in this phase for the next ten months before the breakout of the level of Rs 242.85. Within three months, the price reached the level of Rs 351.5, which is a return of 44% within such a short time frame.
Now came the consolidation phase of a long 10 years(highlighted in the chart with the big orange box). The SBI share price kept on testing the levels of support and resistance several times during this ten-year journey. This time period is a long and frustrating one for an investor. There are investors who get frustrated and there are the ones who keep on holding the shares during such trying times and reap the benefits later on. One has to keep an eye on the charts on the time frame he is working on to observe any change in the price action pattern.
SBI share price nse finally broke out of this range( highlighted by the downward green arrow) in the month of February 2021 and retested the level of Rs 351.5 in the next two months. Once the breakout retest is completed, the price zooms to new levels. As you can see above, the price reached new all-time highs of Rs 629.2 in the month of December 2022. The breakout resulted in a return of 79% within 22 months. As you can see, the SBI share price is again in the consolidation zone and a decisive upward or downward move is awaited to decide our further course of action.
Readers need to study the charts regularly and observe changes in the price action to understand it better and make informed decisions on their investments.
SBI share price target 2025 to 2030
The line chart below represents the share price target of SBI from the year 2025 to 2030. The same has been derived from our limited knowledge and experience in the markets. Readers are advised to consult their financial advisors before making any decision on their investments in the market.

SBI share price target 2028 may be Rs 845 and the SBI share price target 2029 may be Rs 975.
| Year | Low | High | Target |
| 2024 | 575 | 655 | 635 |
| 2025 | 575 | 605 | 580 |
| 2026 | 635 | 700 | 655 |
| 2027 | 650 | 785 | 780 |
| 2028 | 795 | 870 | 845 |
| 2029 | 870 | 985 | 975 |
| 2030 | 980 | 1220 | 1180 |
SBI 52-week share price
The table below contains the 52-week Open, High, Low, and close price of SBI in a monthly time frame.
| Date | OPEN | HIGH | LOW | close |
| 31-Oct-23 | 567 | 569.5 | 563.15 | 565.55 |
| 03-Oct-23 | 596.6 | 604.9 | 589.6 | 602.95 |
| 29-Sep-23 | 592.85 | 600 | 591.3 | 598.55 |
| 01-Sep-23 | 562.7 | 571.2 | 562.1 | 569.55 |
| 31-Aug-23 | 569.3 | 570.3 | 559.4 | 561.35 |
| 01-Aug-23 | 620.2 | 620.85 | 610.6 | 611.85 |
| 31-Jul-23 | 616.65 | 621 | 614.5 | 620.2 |
| 03-Jul-23 | 574.5 | 586.35 | 573.9 | 585.45 |
| 30-Jun-23 | 574 | 574 | 570.2 | 572.85 |
| 01-Jun-23 | 581.8 | 586.4 | 581 | 582.75 |
| 31-May-23 | 583.8 | 584.8 | 577.5 | 579.85 |
| 02-May-23 | 580 | 580.85 | 573.15 | 575.3 |
| 28-Apr-23 | 567.8 | 580.45 | 565.5 | 578.3 |
| 03-Apr-23 | 524.75 | 528.5 | 522.1 | 526.75 |
| 31-Mar-23 | 520.65 | 524.9 | 519.35 | 523.75 |
| 01-Mar-23 | 523.25 | 537.4 | 523.1 | 536.7 |
| 28-Feb-23 | 527.25 | 528.45 | 521.05 | 522.8 |
| 01-Feb-23 | 561.4 | 565 | 499.35 | 527.35 |
| 31-Jan-23 | 545 | 557 | 537.85 | 553.5 |
| 02-Jan-23 | 614.95 | 619.2 | 611.2 | 612.2 |
| 30-Dec-22 | 615.25 | 620.55 | 611.35 | 613.7 |
| 01-Dec-22 | 607.85 | 609.8 | 601.55 | 608.1 |
What is SBI share price target 2025?
The share price target of SBI for the year 2025 is Rs 580. This is so as the share price is expected to consolidate for some more time.
What is SBI share price target 2030?
The share price pf SBI may reach the level of Rs 1180 by the year 2030.
What is SBI share price nse today live?
Readers can check SBI share price today live chart on the website tradingview. The SBI share price live can be checked on the same website or on nseindia.
What is SBI share price target tomorrow?
What is SBI share price history?
The 52-week OHLC(Open, High, Low, Close) price of SBI is shared above. Readers can check the SBI share price history on the website nseindia.
Where can SBI share price chart live be checked?
Readers can check the live share price chart of SBI on the website tradingview.
Disclaimer
It is to be noted that we are not SEBI-registered analysts. The above blog post is aimed to educate the investors and is in no way to influence any investment decision of the readers. The blog post is based on our limited knowledge of the markets and our decade-long experience. No one should take this as an investment advice. The investments in the market are subject to market risks. Readers who wish to learn more please check the links below:
- NMDC steel share price target 2025
- Tata Motors share price target 2025
- Kritika wires share price target 2025
- Asian Paints share price target 2025
- Pidilite share price target 2025
- NTPC share price target 2025
- Suzlon share price target 2025
- Yes bank share price target 2025
- Natco pharma share price target 2025
- Maruti suzuki share price target 2025